
A new study by Malloy Law, using data from the National Highway Traffic Safety Administration and the Bureau of Transportation Statistics, exposes where road rage, aggressive driving, and fatal car accidents are most common across America’s highways.
The research analyzed motor vehicle crashes, fatal crashes, DUI arrests, and speeding tickets, assigning each state a “Road Rage Score.” The numbers paint a clear picture of bad driving, driver behavior, and rising traffic fatalities nationwide.
Since 2018, violent driving incidents and gun violence related to traffic disputes have doubled. In 2023 alone, there was a fatality rate increase tied to road rage and impaired driving, with someone hurt in a vehicular incident almost daily. Victims of such tragic collisions often turn to an experienced car crash lawyer to help them seek justice and compensation for their losses. Below are the 10 states leading America’s list of worst drivers.
10. Delaware – Road Rage Score: 49.32
Delaware’s dense traffic accidents along I-95 contribute to frequent aggressive driving. Despite being a small state, construction zones and road infrastructure challenges make drivers lose patience quickly. These conditions also raise insurance rates and auto insurance claims, according to the Insurance Institute for Highway Safety.
9. Nevada – Road Rage Score: 49.61

Between Las Vegas congestion and Vegas traffic, Nevada earns its place on this list. Long desert vehicle miles traveled and sudden weather changes lead to speeding-related incidents. Tourists add confusion, causing car accidents and disputes over lane discipline, increasing law enforcement response calls statewide.
8. Arkansas – Road Rage Score: 51.02
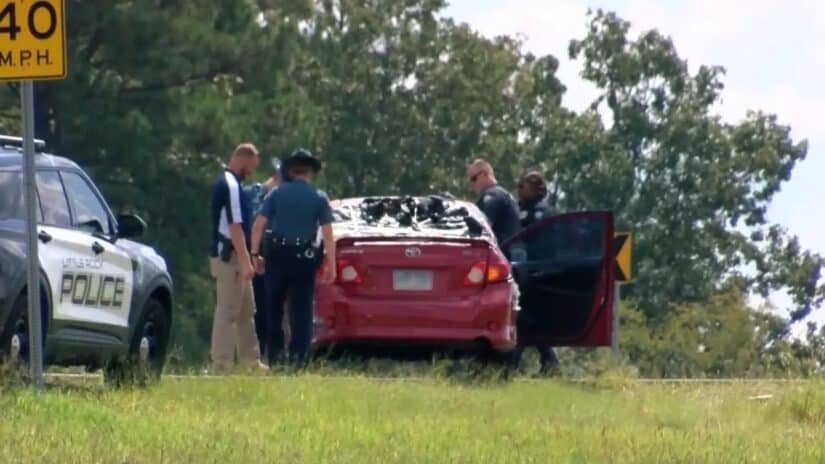
From rural American highways to city intersections, aggressive driving in Arkansas is a growing concern. DUI arrests, drunk driving, and impaired driving continue to strain public safety efforts. Poor roadway designs and limited police presence often mean small altercations become fatal crashes.
7. North Carolina – Road Rage Score: 51.74
North Carolina combines beach traffic, mountain routes, and fast-growing cities. Beach season congestion near Raleigh and Charlotte increases motor vehicle fatalities and pedestrian fatalities. Add tourists, and tempers flare. Law enforcement reports also show rising speeding tickets and auto accident fatalities.
6. Montana – Road Rage Score: 54.86

With wide-open land and minimal public transport, Montana drivers face isolation, long drives, and limited law enforcement visibility. When road rage erupts, it escalates fast. Sparse security service coverage and low seatbelt use make fatal crash rates alarmingly high compared to national averages.
5. Wisconsin – Road Rage Score: 54.33
Known for hospitality, Wisconsin also ranks high for aggressive driving and speeding tickets. Endless construction zones, icy roads, and merging issues fuel car accidents. Winter leads to many auto accident lawyer consultations, as insured drivers and uninsured drivers both face claims after motor vehicle crashes.
4. Louisiana – Road Rage Score: 62.68

Louisiana has one of the highest traffic fatalities and fatal crash rates in the U.S. due to poor road infrastructure, potholes, and crowded cities like Baton Rouge. Drunk driving and positive blood alcohol content readings are common causes of fatal car accidents, with blood-alcohol content averages above legal limits.
3. New Mexico – Road Rage Score: 62.56

New Mexico leads the nation in road rage cases involving gun violence. In 2022, over two incidents per 100,000 residents involved firearms during vehicular incidents. Sparse law enforcement, long vehicle miles traveled, and high DUI arrests make it one of the most dangerous states for driver safety and public health.
2. New Jersey – Road Rage Score: 65.40
Crowded highways, impatient drivers, and constant traffic accidents define New Jersey. Heavy economic activity and the education system commuting contribute to daily stress. Google trends data shows frequent Google searches for “traffic school” and “aggressive driving laws.” Congestion increases auto insurance costs and insured rate fluctuations.
1. Colorado – Road Rage Score: 65.93

Colorado tops the list for worst drivers and confrontational drivers. As Denver’s economic activity and population boom, law enforcement struggles to handle rising driving incidents, fatal car accidents, and DUI arrests. Rapid growth, high altitude, and unpredictable weather make America’s highways through Colorado a test of patience.
How Road Rage Became a National Problem
The National Highway Safety Traffic Administration and Bureau of Transportation Statistics confirm that road rage, drunk driving, and speeding-related incidents are all rising. Factors include:
- Increased traffic accidents from urban expansion.
- Stress from crime rates, public health, and economic activity.
- Declining driver safety training.
- Poor road infrastructure and aging roadway designs.
The Insurance Institute for Highway Safety notes a connection between aggressive driving and higher insurance rates. Meanwhile, Touchpoint Markets research links auto insurance costs and fatal car accidents to high driving incidents and fatality rates in states with lower seatbelt use.
Recognizing Road Rage Behavior
Common signs of road rage or bad driving include:
- Excessive honking or flashing lights
- Tailgating in construction zones
- Cutting off other vehicles on American highways
- Exiting vehicles to argue
- Impaired driving or drunk driving behaviors
Experts from the University of Chicago studying driver behavior note that these actions contribute directly to public safety threats and increase pedestrian fatalities and auto accident fatalities.
The Role of Law Enforcement and Data Tracking
Law enforcement plays a key role in tracking motor vehicle crashes and issuing speeding tickets. Data from the Bureau of Transportation Statistics and National Highway Traffic Safety Administration helps identify dangerous corridors. Reports from Kansas City, Rhode Island, and South Dakota show similar increases in driving incidents and fatal crashes.
Google searches for “driver safety” and “traffic school” rise after every major road rage report. State patrols also use data to monitor seatbelt use, blood alcohol level, and positive blood alcohol content readings during stops.
Auto Insurance and Legal Implications
With higher insurance rates and rising vehicle thefts, auto insurance providers are tightening coverage in states with poor driver behavior. Both insured drivers and uninsured drivers face penalties after car accidents.
Low insured rate levels in rural states increase claims for auto accident lawyer services and public safety costs.
FLT Law and similar firms have noted an increase in auto accident fatalities tied to impaired driving and aggressive driving trends. Rising fatal car accidents affect public health, healthcare systems, and state budgets.
Broader Impact on Public Safety
Public safety agencies connect road rage to stress, mental health, and lack of patience. Research also shows that shared celebrations, heavy traffic after sporting events, and poor seatbelt use contribute to spikes in fatal crashes.
Improving education system awareness and promoting driver safety programs can reduce risks.
Technology, Data, and Security Notes
Traffic monitoring systems sometimes encounter online attacks or malformed data from automated feeds. Cloudflare Ray ID and SQL command logs are used to identify site owner security issues in public transport and government security solution databases. Such systems ensure accurate crime rates and fatal crash rates reporting through vehicle miles traveled records.
These security service checks, though unrelated to driving incidents, maintain transparency in state reporting platforms and National Highway Traffic Safety Administration systems.
The Need for Safer Road Infrastructure
Experts argue that redesigning roadway designs and investing in road infrastructure can improve driver behavior. Smarter traffic school programs, improved public health campaigns, and enforcement of aggressive driving laws can lower fatal crash rates and auto insurance costs.
The Role of Data and Law Firms
Legal and insurance professionals rely on data from Google trends, Touchpoint Markets, and Insurance Institute for Highway Safety to interpret driving incidents patterns. States like New Mexico, North Carolina, and Rhode Island show strong correlations between drunk driving, seatbelt use, and fatal car accidents.
About Ted Law
At Ted Law Firm, has become a respected name in handling cases linked to road rage, traffic fatalities, and aggressive driving.We serve families across Aiken, Anderson, Charleston, Columbia, Greenville, Myrtle Beach, North Augusta and Orangeburg. Based in the Southeast, the firm works tirelessly for victims of auto accident fatalities, DUI arrests, and fatal car accidents.Contact us today for a free consultation
